



Real Time In-situ Thickness and Refractive Index Determination when Monitoring Multi-atomic Monolayers .
.
F. FERRIEU1 and C.VALLEE2 .
1Optical Polarimetry Ellipsometry. CH-6945 (Switzerland).
2 SUNY POLY, CNSE, ALBANY (USA).
Abstract: In situ Spectroscopic Ellipsometers (SE), is a precious real time process control tool. As frequently reported in literature, very thin layers measurements don’t yield however simultaneous and uncorrelated values for the thickness tF and the material refractive index (ri). Thickness values are highly related with the choice of an a priori assumed ri which a characteristic of the intrinsic layer’s nature. The paper implements an earlier analysis of the initial Drude equations. We show that when thickness turns ultra-thin then the ellipsometry equations can be solved through a first order expansion in tF. During growth, deposition or in the case of physical adsorption on a substrate, this hypothesis is entirely fulfilled. After describing the simple way to process data, within Atomic Layer Deposition (ALD) examples, it is shown how few physisorbed monolayers case can be handled so far. More general molecular physisorption is also considered. Particularly in the CO2/H2O gas adsorption inter exchange, ellipsometry turns a right method with absorbent like thin or native sub-oxide samples. Both refractive index and thickness with high accuracy are independently reachable and within a rather fast acquisition capability. In vacuum chambers, the stability of alignment is just being done one time and fully optimized. A fixed physical configuration inside vacuum chambers acts with benefit over usual limiting factors. An evident interest appears in atomic layer deposition or etching as well for molecular beam epitaxy and chemical vapor depositions techniques, and sputtering. With today’s “no moving part” or “one single shot” photonic technologies, Spectroscopic Ellipsometers within this configuration can provide sensitivity more than Surface Plasmon Resonance SPR which measures only the optical thickness. With the use of a limited number of wavelengths, SE exist in wide applications fields and furthermore depolarization factor acquisition gives an additional information on the player building accomplishment. Since the pioneer works from H. Arwin, a large opening for bio photonic sensors appears also today. Thin silica interacting with ambient is recognized as specific adsorbents material for gases and proteins detection which is observed here in “native” oxides layers.
1 Introduction
While easily detected, mono-layers as well as thin layer below few nanometers, are not so easy to analyze with Spectroscopic Ellipsometry (SE). Many examples exist as well from various fields especially in biology with adsorbed mono layers. Initially described as “transition layer” by P. Drude [1], this “top” monolayer can be assimilated also to a physisorption, porosimetry phenomena and/or atomic layers deposited or grown by molecular beam epitaxy processing. However even when considering a wide spectroscopic range or and with variable angle techniques, it was finally admitted that SE does not really solve this goal. For monolayers the main issue is how to determine simultaneously two parameters. As for porosimetry, in biology applications,[2-3], H. Arwin quoted earlier : ”it is often stated that it is impossible, or at least very hard, to resolve both tF and nF for a thin film in an ellipsometry experiment”. Today, new photonic designs are implemented in SE instruments. The technique has been presented as a potential tool in parallel fields like immunology testing of the “Adsorption of Proteins at Solid Surfaces” [3-6] This is something which turned as a crucial expectation in today’s researches in immunology as an antigens body detection tool.
Indeed different methods like surface plasmon resonance (SPR), measure optical thickness and as well refractive index variation [5][6] and an intensive efforts is given today to increase their precision . In fact the refractive index is expected to be known at almost within a 10-3 to 10-4 accuracy limits. Does ellipsometry could be used as well ?. In fact some developments based on the very early Drude descriptions[1], lead research today to reconsider the Fresnel equations as well. In other terms, this approach should turn into an unambiguous determination of both refractive nFilm and film thickness tfilm in this few nanometers range .Since several years, in a last publication has given a promising answer[7] . Though a review and the analysis of the theory is at first mandatory here.
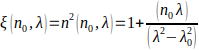
Below 5 nanometers (nm), for most oxide layers as grown from a substrate like silicon (Si) interlayer thickness determination as a general admitted concept, is to consider a fixed value of the refractive index (r.i.), e. g. either 1.457 1.46 at 633nm or less considering native oxide ( currently most native oxide are 1.0 to 2.5 nanometer-thick). Initial first theories were most involving this“ as transition layer” describing the fact that in nature no discontinuities exist. With native oxide the classical models use often a parametrized Cauchy or Sell Meyer law as shown here, i. e.
(1) 
or an equivalent “ absorption Urbach tail edged” formula associated with
(1-a) 
with λ as the light wavelength, the validity remains inside a specified interval range( e. g. the Urbach absorption tail in edge of the visible range). For example, we have n633nm =1.99 and nslope =0.03 for zinc oxide (ZnO).[8] These parameters are well-known for years from thicker samples works. Yet in the nineteens, these models were refined introducing also a more or less densified materials concept through the Effective Medium Approximation (EMA). The Lorentz Lorenz equation for a mixture of material whose complex dielectric constants and volume fractions are respectively and fi and the Bruggeman formula for computingin terms of and fi is, The are respective relative volume fractions for host and depolarizing electric field with spherical voids and the film optical index with The thickness tF . For calibrated samples with electron microscopy can then be used as references too.
1.a The Instrumentation Developments
Among SE candidates choosing the SE instruments “single shot SE “ are very attractive. As a new instrument generation, they affords direct real time observation access of the phenomena within short time scale less than 50 milliseconds (ms). Considering analytical models, not only one but with a limited number of wavelengths is also a sufficient criterium. Single shot SE are thus really to be chosen. Today as a pioneer and prior than these future instruments has been afforded, exist the commercially available fast Wide Band multi-Wavelength Ellipsometers already seen as “no moving part “ [9] But it is not unique. In these last years, new systems should be soon reported in literature. See the last R. A. Azzam retrospective [10]. These future designs can be denominated also by “single shot ellipsometer” or “no moving parts” Ellipsometer or polarimeters. They are the near future tools in real time dynamic processing. They are also accurate when their limit reaches the quantum noise “glass ceiling” seen as the intrinsic source “photon noise limit”[11-a]. Only new quantum dots pulse light sources might overcome it. Presently, let us show and comfort the ability to drive any thin layer material growth. This important aspect indeed goes with the scaling down below 5 nm-thickness as it is presently for the nano 3-D scale domain of the IC technologies. Spectroscopic Ellipsometry, (SE) must provide also a plain real time fast enough quality control tool. If spectroscopic measurements requires the largest possible spectral range for new materials, the bill to pay is an increase of the acquisition time during measurements. In industry, there are no needs to measure so many usefulness wavelengths data. The analytical models describing most dielectrics in the visible range exist and are known since the nineteens and present database available on the web [12]. The use some how of a first candidate under this “one single shot ellipsometer” termination is thus of concern. A multi wavelengths division-of-amplitude ellipsometer (DOA) is an old concept from the first papers of R. Azzam , G. Tompkins , E. A. Irene[13 ]. Together with providing an additional parameter, the degree of polarization P is a not yet well interpreted. The no “moving parts” aspect and ”new” LED sources use, prevents from tedious alignments and limited life time sources replacements procedures. Furthermore LEDs sources own less noise than the classical Xe xenon sources of the first instruments [10]. Each acquisition step displays in real time the N, C, S classical stoke vector components values. A full description can be found from supplier’s white papers and implicit patents[14]. With a limited number of 4 wavelengths, this concept yields a fast acquisition mode without any moving optical elements in the beam with a roughly 50-100ms acquisition rate, covering the visible range with these wide LEDS bands at respectively 463, 524, 595 and 637nm wavelengths. This wavelengths number is not unique as it is now 6 in the latest instrument versions. It also runs at a very fast acquisition modes. Spectral range cover efficiently the visible range. This SE can be seen as a first pioneer tool with up to six wavelengths available today. Nevertheless one has to keep in mind that other solutions using new integrated photonic designs exist and a wish is to see them soon available in commercial versions. As other perspectives, an additional parameter which will be review later in this paper is a value of the degree of polarization Pexp which should be equal to the degree of polarizationand introduces a surface roughness parameter due to light diffusion as we shall see hereafter. Some slight modifications of the instrument could turn even them into a complete polarimeter as well. An other advantage is that no tedious alignments are involved before the ellipsometry ratio can be retrieved. The quantities related to the reflected Stoke vectors of light by the surface are measured. Dynamic data for real time process directly provides the equivalent normalized Stokes vector S= {-S1/S0, S2/S0, -S3/S0} usually represented on the Poincaré sphere of radius |S|=1. Single, continuous and dynamic measurements turn today to be in the basic software tools. An additional advantage is the remote access. Extracted from a measurement area through VNC (Virtual Network Communication) software become a high advantage when internal internet connected objects (IoT) are concerned as seen also here later. To a short overview from data acquisition, one obtains the well known ellipsometry usual angular values Ψ, Δ , P associated to ρ=C+j S/(1+N) with N=cos 2Ψ , C=sin2Ψ cos Δ and S= sin2 Ψ sin Δ The streaming mode stores directly data and fasten acquisition rate. Data are being later re-analyzed or parallely processed. Both incidence angle aoi= and substrate refractive index nsubstrate (or n2 ) values affect only ρo the origin ordinate and ρo refer ideally only to a bare surface (tfilm=0). The accuracy limit could be also originated from the angle of incidence (aoi) selecting various position shifts of the samples in the xy mapping experiment. Here the refractive index remains of the order of a 10-2 accuracy range. It’s definitely better the case for in situ systems with a fixed previous alignment and no modulating elements.
1-a Some examples and the theoretical Interpretations
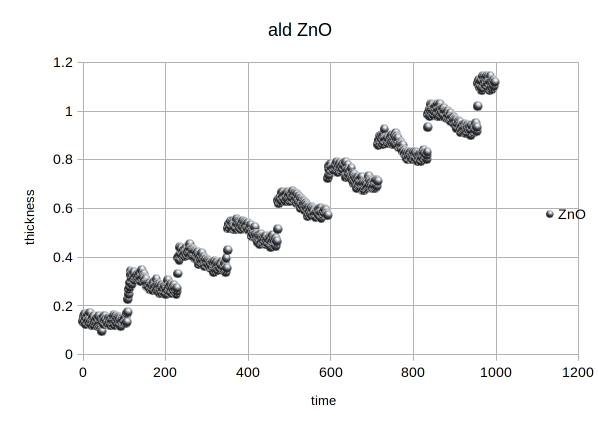
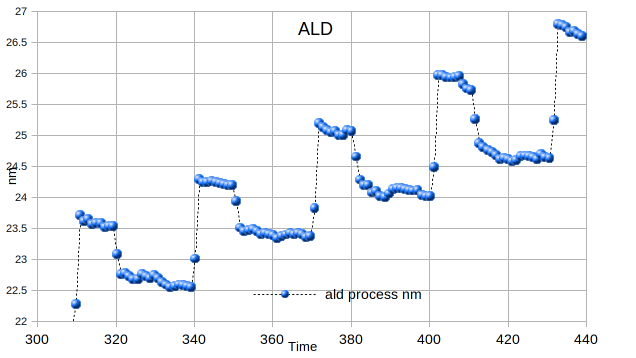
In that thickness range, the Drude expansion takes it most powerful interest, a necessary basis to understand today’s experimental results. In real time, when processing atomic layer deposition, (ald), atomic monolayer hypothetically one by one atomic layer building, is usually followed with various techniques like quartz QCM or optical emission spectroscopy (OES) inside the ald or the mbe chamber. In ald the intrinsic process is based on subsequent physical and chemical adsorption atomic reaction which can be called as “in vivo” phases. With e.g., ZnO ,it is also involving H2O “oxidant rinsing”, and nitrogen N2 ”purging” : Shown below in Fig. 1, thickness curves (t-curves) represents the multi layer atomic growth in the fourth phases: the ZnO introduction process on Si at 300°C and detailed in Fig(1a) on left.
 |
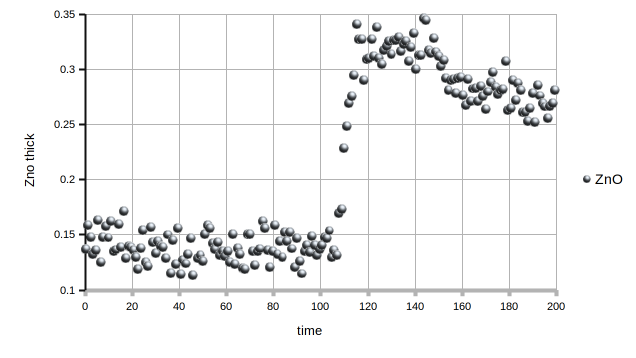 |
lt also shows the different phases,i. e. growth ,water introduction “rinsing “and N2 nitrogen “purge” [8]. One Zn oxide growth cycle contains nevertheless four steps of sequential gas injections into the reactor chamber:the Zn material precursor, a purge of the reactor chamber with inert gas, injection of an oxidant and again purge. An Organometallic like Zn (C2H5)2 and water H2O are respectively here the precursor and the oxidant, and nitrogen N2 inert gas for purging the reactor. Processing SE analysis with faster rate, should indeed lead to a complete understanding of the phenomena, implying the role of water. Slow SE acquisition rate will only identify these growth phases according to the maker’s recipes. Within the classical ellipsometry parameters, considering the SE trajectories are obtained from with various film thickness tfilm and nfilm .. and thus access to the process and transformation on the sample surface as also observed early by Drude[1]. He argued at that time also that “when light passes from ambient 1 to the substrate medium 2 there is a discontinuity at the interface. But strictly speaking there is no discontinuity in nature” .Thus there is always a thin transition layer within which the dielectric constant varies from to . Unambiguously It has to include the native oxide layer as light visible wavelengths are much larger than the depicted interface. Inclusion in a second order development of the complex ratio ρ = Rp/Rs versus X=( 2π tF /λ)~0 , where is the film thickness is then obviously realistic. As long as remains constant in that transition layer, a fortiori means . In many cases furthermore, one deals also with mostly transparent substrates, (i.e., even if these substrate are far to be transparent to the eyes, e. g. in the case for a silicon substrate at 637nm red wavelength gives the imaginary part of n= n +j k with k is k(633nm)~0.018). So far a first order approximation can be established from this serial expansion in t. The real part of ρ and the square of it’s imaginary part [1][7]. as real(ρ) and Imag(ρ) appear as predominant. Already recent authors recalled the concept in literature. More explicitly it is considered with the equations from the Drude description (&7 p 287 and eq 36 p 290, ref [1] that has been explicitly rewritten as(eq.5 & 6 in [7] )
(2a) 
with (2b) 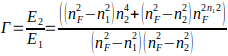
or shortly rewritten as
(2c) 
Here, respectively, indices 1, 2, F, correspond to ambient medium, substrate and film and the angle of incidence (aoi) and transmitted.The direction of the transmitted (tra) light inside the substrate is deduced from the incident (inc) from the Snell laws. From this 2nd order Drude serial expansion versus X=(2π tF / λ) , the second moment contains the slope S, a function only of the upper film intrinsic refractive index nF. independently of the layer thickness tF. Clearly, in such a way considering for example a fully-filled atomic layer growth, successive acquired data yield to equally repetitive abscissa. Imag(ρ)2 steps. From X=(2π tF / λ,), the value of ρ = rp / rs can be exactly determined using the complete Jones formalism. This is a way to check the validity limit. In the case of a monolayer on top of a substrate,(0 ambient,1 layer,2 substrate), one has(eq 4.37 and 4.38 p.285 in [13]
((4) 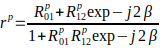 and
and 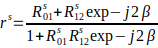
The refractive indices n2, k2 involved in R01,R02 are known for years from published data basis[8] and the angle of incidence (aoi) only once got from experiment and (eq 4.31 and 4.32 p.284 in [13]. In Eq (4) Rp, Rs can be exactly recalculated and so far the the zero thickness abscissa value ) . As we have with
(5a) 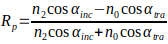 (
( 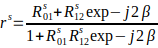
with (Snell’s law)(eq 4.3 p.271 in [13]. To summarize, the nF value is extracted from the observed S using these analytical equations[1]. From this linearity, the distance between each of these points with respect to yield to a thickness providing also change in the refractive index nF.. In Figure 1, however, several phases are involved thus selected time windows are to be selected. This real time atomic layer ald process example shows as previously mentioned successive time phases as physisorption and oxidation catalyzed by H2O first referred as “rinsing” followed by the nitrogen “purging”. All these more sophisticated reactions in process are usually hidden phenomena with slower SE instruments observation as shown below
2 Experimental Probing :
2.1 a x-y manual mapping
A simple x-y mapping on a silicon wafer is an easy check. From earlier times, this approach was commonly used with beveled samples for refractive index determination purposes. Here, it can be accomplished using “non-homogeneous” samples. By x-y hand displacement, manually shifting the sample the instrument holder can be done while measurements are made in the same time. Some part of the wafer might be also seen as closest to a bare substrate. This was here the case for this thin alumina Al2O3 ald growth sample. This choice evidently corroborates literature refractive indices database (reproduced in Table 1 or from ref [12]).while the SE tool specifications are given as better than 0.2 nanometers (nm). As checked with a bare Si wafer, tox and aoi, are retrieved using the “Reference Model” recipe[9] (involving a fixed adequate reduced number of parameters previously adjusted with calibrated samples).Previous care has been taken to correctly align the instrument and optimize it in order to keep constant. Thus the angle of incidence must remain under 5x10⁻² degrees limits. Similar results are observed for similar x-y “with hands” scannings of a 21nm-thick aluminate (Al2O3)-ald deposited wafer, as probing the SE sensitivity too. A non homogeneous thin oxide layer , while running dynamic repetitive mode, demonstrate the ellipsometer stability. These thicknesses tFilm are reported versus the time elapsed between each spatial shift Then the film thickness tFilm stays in between 21,9 and 22,1 nm, a less than 0.2nm,i. e., a two angstroems repeatability. The homogeneity of the film is optima as kept inside the process specifications. With the instrument one get ρexp=C+i S/(1+N) with N=cos 2Ψ , C=sin2Ψ cos Δ and S= sin2Ψ sin Δ all are corresponding to ideal isotropic Mueller-Jones matrix elements. ( The FS-1 streamings files only provide Ψ , Δ in degrees and Pexp for each source wavelengths[9]).
( 6) 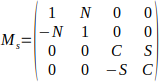
On the Fig. 2 right, the use of equation for real part (ρ)exp. versus Imaginary part [Imag(ρ)]²exp., at the different wavelengths instrument LED sources and the trend linear equations for the 4 wavelengths of the SE are presented On the left the usual t curve recorded during the ald growth versus time.
2. Calculations and checks As a fit to after this analysis of ρexp.., the linearity observed is retrieved with calculated values fixing an incidence angle , aoi=64.95= degrees and the sources wavelengths. The parameters issued from literature,(see also Table 1), returns directly these data (i.e. as shown with the straight continuous lines). Aluminate oxide experiment was completed with a regular thin oxidized silicon wafer left for years “on the lab shelves”.The sample provided similar results but unfortunately the real nature of a organic carbon polluted native oxide remains uncertain. It did not enable us then to validate the real absolute nf value. But in this case of a thin inhomogeneous ald alumina sample, considering of the ellipsometry trajectories, the sensitivity is full enough to get both parameters using basic values from table 1 and 2. with nF=1.67, i. e. the literature accepted value
Other examples followed and can be presented here too. In-situ atomic layer deposition (ald) experiments, during some first runs of their in-situ ald chamber are shown as well. Respective temperatures deposition windows, i. e., (at 180°C) di-ethylene zinc oxide, ZnO(C2H2) were investigated. As the growth or deposition process kinetic are always in the same spatial configuration, (i.e., the incident angle (aoi), remain unchanged), more accurate and absolute value of the refractive index can be extracted independently of other parameters .and (200°C)alumina Al2O3 coating, respectively.[9] see Figure 2a and b .
 |
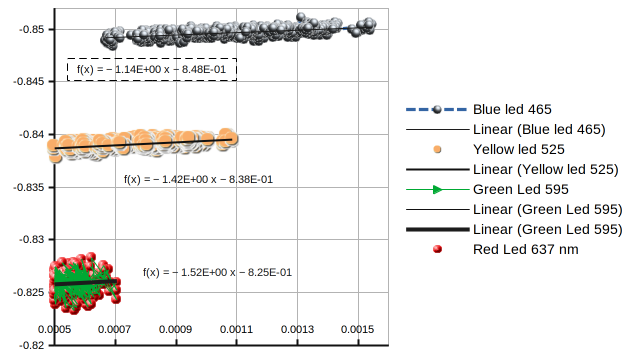 |
| Fig2. Small wafer by hand shifted spatial positions displacements on a wafer with native oxide on top tF : As SE measured versus wafer position (right figure) during time, on the left , the corresponding linear plots for the wavelengths LED light sources ,here,465, 565 595 and 637nm, from the SE ellipsometer (ex situ data :See details in text) | |
The first case (in Fig 2 deals with thickness data taken on an ald chamber .The temperature was 200°C. The results can be fitted for both the slope S gives nFilm value close here to 1.68, whereas the values of the aoi and nsubstrate correspond very well to the expected origin ordinate ρo .Priorly, experimental data were taken in situ and reported for a laboratory “custom build” [8] “ chamber (300 °C) in case of zinc oxide, ZnO ald during in situ real time coating. The used incidence angle unfortunately was quite out of regular ellipsometry optimal conditions,i. e. aoi ~ 34 degrees and corresponding substrate indices were to be estimated at this temperature. With literature values and a previously measured incidence angle,(aoi), in fact no fitting parameters remain quite necessary. while observing a perfect linearity in experiment as well as with calculations. Furthermore it occurs in the time range 80-130 secs during the ZnO(C2H2) introduction and atomic layer adsorption “capture”. Reporting these examples for several ald real time cycles experiments also demonstrates the linear approximation validity. When data have to be fitted in order to extract quantitative results from both slope S and ordinate origine ρ0 , which can be done easily picking up the linear trend lines given by the Microsoft Excel software or Libre Office ( Linux) and compared to the values from Eq (2).see Fig.2b
|
Wavelengths |
N+ i ksubstrat |
n(Al2O3) |
|
|
637nm(25°C) |
|
3.881+i0.0182 |
1.6770 |
|
n(300°C Silicon) |
465.46 |
4.7207 0.15639 |
1.682 |
|
|
525.05 |
4.03056 0.078672 |
|
|
|
595.62 |
4.0559 0.044039 |
|
|
|
637.14 |
3.961 0.0326 |
Fit :nFilm=1.68 |
3. The Surface Control & Influence of Environment Ambient : An Instrumental Development setup of a surface analysis chamber
In front of this former experience leads us to use the ellipsometer to examine the potential adsorption of various environmental gas ambient. As allowed today with use of the Internet of things, (IoT, objects developments), many low cost sensors can provide real time various gas compositions and ambient parameters as well, i.e. temperature ,humidity %RH and atmospheric pressure with a pretty good reproducibility and and accuracy. The idea is to demonstrate the instrument potential while working in controlled atmosphere with the gas ambient environment influence on material surfaces . This is a potential applications of SE as biosensor which is already a reality. Details and first results are so far discussed in literature showing in this context the potentiality offered by ellipsometry[10][12][13]. For this purpose a gas control chamber at ambient atmospheric pressure has been considered around the instrument with all a remote setup . The ability to provide separate ambient parameters simultaneously are given by IoT sensors . Such an ambient gas chamber setup is reported with the complete setup (Fig. 6): Here, on the right side are shown the PSA, Polarization State Analyzer side of the SE, here with the FS-1 ellipsometer [14]. Using a simple virtual Private Network (VPN) enable an easy smart phone coupling, ( the white screen here). That helps considerally adjustment setting of the instrument. On the picture of the assembly and from the front white bread-board several sensors plugged in . They control the ambient gas present inside this closed gas cabinet through the same I2c bus protocol. On the left side the Polarization State Generator PSG is adapted to the mounting FS-1 unit and finally (Fig.7) in front shows the electronic part, i.e. a small processor driving both sensors and the SE together. The interface control is thus accessed through a complete remote Communication (VNC) capabilities[15].
This chamber includes different sensors giving respectively CO2 concentration (ppm) but also various gas as N2,NH3,CO, or CH4 and percent % O2 as well as ambient hectoPascal data.pressures (hPa) and relative H2O water percent humidity, (%RH), Temperature t°C, and clean room particles P 2.5µ and 10µ ppm counts parameters are checked too. The %RH is easily convert to ppm volume [16] The various other gas species are therefore measured inside. Simultaneous control adjusting the delay between each experiments are performed during hours, e.g., integrating up to 6 sensors data. Acquisition rate is limited to the sensor’s response (1sec).whereas the ellipsometer rate is up to 50ms with 6 wavelengths. Previous repeatability measurements were checked performing acquisition during several days, stabilized temperature and within atmospheric pressure control (less than 1 degree Celsius and normal day pressure evolution )[15].
3-a Applications :
One technology for capturing atmospheric carbon oxide CO2 is the use of adsorption/absorption processes through mainly aerogel compounds. Usual choices concerns mostly silica as mesoporous materials often quoted in IC’s “low k” dielectrics. A lot of considerations has been done in much larger field for these materials referenced in a considerable literature The “physisorption” traduces the interaction between an ionic solid and an electrically neutral but polar gas adsorbate molecule. A classical example is the binary carbon oxide CO2/ H2O physisorption phenomena present in atmospheric ambient. The interaction is between a mostly pending bounds thin oxide and a polar adsorbate through a quadrupole interaction. Here relative humidity is assumed to play a somewhat significant catalysis effect Let’s recall as a well-known opposite effect that is the relative humidity content ( %RH) which greatly affects the thermal kinetic silicon oxidation rate which is also due to catalysis effect as it is in the ZnO ald building. In the adsorption isotherm process, the presence of small amount of H2O in the gas mixture has a significant impact on the adsorption loads and the CO2 capture. In fact a minimum humidity amount is even mandatory to start and enhance such a process.
However to our knowledge, clearly little and precise mechanism of how react carbon dioxide at the adsorbed water−oxide interface is yet given. A thin water films is estimated as roughly ∼1-2 monolayers when relative humidity reach 100%. That certainly plays a critical role. It is essential to understand the “chemistry” of these “wet” interfaces embedded in atmospheric gas[17-20]. Enhancing CO2 uptake, H2O is influencing the chemical nature of the predominant adsorbed product on the surface oxygen bonding from unsaturated silicate to carbonate. The resultant thin water film should be acidic in nature from the reaction of CO2.and turning open bounds Si-OH to -C=O-OH bridges with the unsaturated hydroxyl SiO-H groups.
The case of polar CO2(-OH+C+HO-) leads to bindings bridges activated by the H2O layer. The role of water H2O here is to enhance indeed this context as catalysis oxidant. In the surface chemistry of carbon dioxide, the combination of a molecular water layer on the SiO2 oxide interface is very fundamental. This interface chemistry has been investigated on many other aero-gel-like but structured zeolites too. It is of interest to consider the creation of these “wet” interfaces within atmospheric gas. But the detection level is expected to be somehow of the order and less in the nanometer range. The competition of CO2/H2O capture is yet reported in literature [18]. A two sites Langmuir equation is already reported describing this effect. But a question remains as far as CO2 adsorbate is creating a super layer on top of the silica or is it completely adsorbed inside the adsorbent silica layer modifying the global refractive index of the layer. This latest option seems to be also retained recently and the results presented hereafter could be seen as well as a clear demonstration of this “sponge” capacity. Does the effect apply to other adsorbates as it was recently shown while considering biology and also immunology with antigens proteins ?. As a very simple example, human breathing can be seen unsurprisingly also as a humidity and CO2mixing.
Using classical approach, i.e., acquiring the t-curve reference model, change and increase of an “effective” thickness are observed even in a so tiny effect. To say shortly, with “classical”, it means use of the instrument reference calibration model, i.e. a fixed oxide layer index with another varying parameters as the incidence angle aoi- The fitting concerns measure of an equivalent thickness. Measuring an equivalent thickness (or t-curve ), turns as being absolutely ignoring the real chemical structure of this effective layer but demonstrating some presence of a similar “physi-adsorbed” layer on top. In reality, most reports use t-curves while considering classical porosimetry isotherms analysis. Here,only two aspects can be deduced from this basic curve : a) the reversibility: a fast reaching time interval forward saturation state followed by a slow in time desorption and b) a thickness range scale of only few nanometers. It should be of adsorption the order or less than one to 20 angstroms-thick layers (0.1 to 2nm). The analysis shows that this thickness change is above the SE today’s repeatability. The question on how the H2O content induces the adsorption of CO2 or reverse remains unanswered. From the Iot sensors readings, only the water H2O relative humidity, i.e., ratio %RH H2O/CO2 and Carbon dioxide data are recorded together with ellipsometry C,S, N data . The Figure 8 report in abscissa, the equivalent thickness ellipsometer measurements Equivalent Thickness (EQ)-thick(nm) or also denominated as “t-curve” and shown versus the ppm (right) of relative or (left) the %RH content. These two “phases”. Include a pseudo “exponential decrease shape ” time desorption mechanism as in Fig 9. More precisely, a constant mixing ratio CO2/ %RH is introduced in the chamber Fig ,while measuring the CO2 ppm content up to 20,000 CO2 ppm and humidity ratio CO2 / %RH. Then the process is stopped and slowly with the chamber leaks drive a return to atmospheric conditions,(450ppm CO2 and ~40%RH). Although to our knowledge this effect is scarcely reported for ultra thin films and even this first approach remains qualitative because of the uncontrolled nature of native oxide in the samples.
These isotherms are similar to a type IV hysteresis isotherms but in a “reversed” direction.It is reminded that Type IV are usually attributed to characteristic of a mesoporous materials, classified as containing pores with diameters between 2 and 50 nm. The increase of the slope at higher “relative pressures” indicates an increased adsorbate “uptake” when the pores are very fast filled. Following the arrow of Fig.7 the inflection occurs usually near the end of the fast filling of the thin oxide. For adsorbents porous materials having pores in this radius range, this hysteresis loop is explained by the different way in which capillary condensation occurs when the pores fill and empty as soon as the %rh/ ppm CO2 ratio returns to the laboratory equilibrium ambient values Detecting thin layers as below as less than 5nm in thickness, has been for a long time a challenge never overcome. H. Arwin already in the eighties faced the problem by showing the potential interest of ellipsometry for “bio-sensing” and saw silica as pseudo sponge for various proteins. Today many publications and a large literature describe this refractive index changes due to these phenomena [2][3].
4 The P. Nestler,C.Helm [7] analysis
Formerly the Drude procedure [1] reviewed by Nestler and Helm turns a key point. As reminder, solving equations (2) and (3) with the slope S enable to obtain the film index value. These equations can be re-formulated and just applied to the case of an isotherm adsorption kinetic versus time t. That is, when calculating the experiment slope versus time:
(7 ) 
Thus the variable t is the time evolution of the complete layer. An initial value tinitial corresponds to the bulk substrate without or with any layer , (the ideal should be perfectly clean bare substrate sample), before starting the process. For real sample it will be in fact, the native oxide layer always present on top of the substrate and seen here, as the adsorbent material. Furthermore,which can be evaluated from eq (3) or measured from acquisition global data from the origin ordinate. The slope S equation for E1 / E2 is deducible, using any symbolic mathematics solver. It yields equation already first published by P. Nestler, C.Ham, deduced from the Drude model ( as shown and deduced from Drude analysis page 290 eq(36) from [1]:
(7.a ) 
and folllowed by
(7-b) 
This can be implemented in the real time acquisition software gathering simultaneously the ellipsometric parameters and all the ambient concentrations of interest, i.e. CO2 ppm (part per million)and relative humidity %RH or H2O ppm, ambient pressure and temperature as done in the porosimetry chamber previously described. Directly it can be re-analyzed after the experiment end using standard Excel office. In Figure 8 the refractive index change versus CO2 concentration in part per million (ppm CO2) is reported .The analysis provides a very high accuracy level since changes in the refractive index remain well below 10⁻⁴ noise To consider is the total porosity Vm which represents the proportion of filled voids in the porous layer volume V. Proceeding further with the mixing EMA theory a total pore size volume V/Vm fraction
(8) 
where ns is the known adsorbent native oxide refractive index r.i. andthe measured r.i. of the film index value. From the measured refractive index n. From the equilibrium between the evaporation and condensation rate at a surface, as described earlier by Brunauer, Emmet and Teller [20] and since the adsorbed volume tends to infinity once p
approaches ps, we may write the following equation:
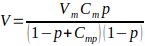 (9)
(9)
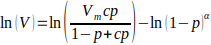
This later Vm is also called the monolayer coverage capacity which can be generalized to the upper value, and p the partial pressure versus the adsorbate liquid saturation pressure ps, here it will be simply the H2O adsorbate %RH. For a constant temperature, the evolution of this surface adsorbed layer thickness t is usually depicted in the literature and currently presented as a t-curves isotherm. But the t thickness as being measured with an a priori value of the refractive index is not clearly defined. It can be usually simply related to Eq. (2) with (10) where d’ is the monolayer effective thickness. Another parameter is also present: the monolayer capacity coefficient rate is seen as a thermally activated coupling factor related to temperature T and bondings activation Energy and thenwith kB the Boltzman constant. In fact, this early theory rapidly failed. Indeed, one has to analyze the isotherm t-curves by reference to all present additional surface forces including the adsorbate themselves interactions. Beside these classical BET equations, theories accounting with the other surface energy interactions emerged later. One of these approaches came from Halsey in 1948, referred as the FHH theory. The multi- layers ‘‘build-up’’ by water adsorption on a clean surface at low partial pressure comes from the interface intensity (and the nature) of long (London (LD) forces), or short (Debye and Keesom interactions) range forces between the water molecule and the analyzed surface. Various approaches have been invoked to answer to their intensity could theoretically be extracted from the isotherm data.
A measure of the film thickness, probes the geometry of the surface over this range of scales. In the FHH case, the number of adsorbed molecules N and the monolayer coverage Nm turns to be related to the fractal dimension D through the Minkowski dimension . In the second BET fractal theory [10],the model takes into account the multi-layer filling along a Koch curve [10]. One get the fractal dimension D from a, but also the other corrected BET parameters, i. e., Cm (BET constant), a function of both adsorbate and adsorbent, a function of temperature T, as well and with Vm the monolayer coverage and the partial pressure p = p/psaturation one has a good approximation only for 0< < 1 and p < 0.75 [13]. Here if [ ]
 (10)
(10)
where D represents the surface fractal dimension of the layer. The adsorbent initial layer present on the substrate, ( here ns< or ~1.457 at 633nm for a native oxide).The results are provided below. On the first row left is the refractive index at 637nm (RED LED) within the desorption process and right the corresponding t-curve versus time. Below, left one sees that the ratio CO2 ppm over ppm H2O remains constant along the experiment , as roughly ~20%. The last plot is a linear fitting representation of a fractal eq(14) see details inset figure below .As far the ratio is evaluated from Eq.(8) and the monolayer effective thickness d` known, the t thickness can then be completely evaluated and which yields here to D=1.2877
.
Depolarization effects during process
Depolarization effect are generally traduced by the Mueller matrices formalism As depicted in Eq.6 a Mueller matrix with N,C,S components is a perfect so-called Mueller-Jones. but remains unrealistic in nature. The developments to Generalized Ellipsometry, while considering real data, G.E.Jellison included such a “depolarization factor” ,writing then from the ideal Mueller Jones eq(6). It gives an isotropic but depolarizing mueller matrix ;
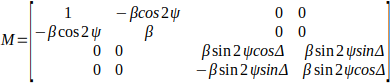 (12)
(12)
The polarization factor turns to unity, , ideal limit in the case of a perfectly smooth surfaces. One inset one must figure out then the following scheme of the physically realizable Mueller matrix equivalence described by the stokes vectors on a normalized Poincaré Sphere and with P<1 (whereas the dimmed sphere correspond to the unity scheme)
Due to “experimental errors” a is observed and might be source of erroneous information on light scattered from surface. This discussion topic is still on discussion with the instrument providers .In Fig 10a, the experimental depolarization factor Pexp from the experimental data in fact should be less or equal to the dop factor . in fact measurements values even greater than unity. This inconsistency ,(with a depolarization factor expected less or equal to unity,i. e. with or (depolarizing) ), leads to reconsider this experimental value At a first order, it has to be normalized respect to it maximum value as dop=Pexp / Pexp`max Nevertheless the complete Cloude [ ], filtering of the isotropic depolarization with 4 identical eigenvalues Mueller matrix should be the right polarimetry answer but unreachable within an only SE scheme option as the corresponding Mueller matrix given as a generalization of the perfect case (where diag( x1 x2...x N ) is a perfect N × N diagonal matrix. Although the associated system Neumann Entropy[20], Fig 10b (right) with
(13)
shows shift of these variations along this theoretical curve For each of these different wavelengths, the experimental normalized dop data inserted in Equation (13) are the associated with a clear return to a null Entropy For each of the 4 wavelengths this return fo a full isotropic surface as soon as desorption is ending.(i. e. with a unitary value), mean the perfect surface. A full Mueller matrix measurement instrument , i. e. a full single shot polarimeter could thus have the capacity to detect a complete atomic layer filling associated with a perfect non depolarizing surface.
5.Discussion & Conclusions:
The film thickness can furthermore refined consequently giving values of any analytical law valid in the visible range. The need of a fast real time acquisition ellipsometer is completely full-filled with a 50ms acquisition rate .As comparison with an optical emission spectrometer (OES),a classical deposition carried out by PE-ALD (100 cycles) is monitored only at an acquisition rate of 200 ms. The remote capability enable furthermore a plain process control. Indeed the refractive index of the monolayer can be followed during the multiple cycles when building the film. Native oxide reveals to be very sensitive to ambient gas environment as aerogel.
These observations might be in a near future consequently used in the basic concept of monolayers biosensors within the today’s proteins detections which are today highly requested in immunology and environmental ambient studies. In a context such as that of nanotechnology it is important to know the surface states of the materials deposited in thin layer and thus SE is determinant.
Various papers exist on the study of surface adsorption (SAXS, SANS, N2 adsorption, positron annihilation, but quite few exist for thin layers. No a priori technique can be chosen through other optical detection method for surfaces. Spectroscopic ellipsometry has the advantage of being adaptable to the case of many studied material and can be done in situ. All surface analysis methods are destructive. XPS analysis, SIM, or AFM or SEM imaging only gives a local idea. The closest method could be haze measurements , but scatterometry remains with very great difficulty to analyze . . A scale of a few angstroms when the size of the adsorbate is the etalon unit . Today, it is difficult to extract truly realistic information except in this latter case, Insofar in the clean room conditions in terms of cleaning and desorption will be carried out even in the most reproducible manner. Nevertheless, the effects demonstrated by this review are striking and confirm the potential of Ellipsometry, hence the interest of taking precedence over many techniques.
SE has been reviewed here as a method of surface analysis which uses a scale of the size of a molecule to measure the roughness of a surface, and its dimensionality. Among the monitoring of adsorption and optical surface observation the technique is unique :
The use of the ellipsometry ratio ρ linear relationship between real and the square of its imaginary par is a key procedure when performing the data analysis. In a very reduced thickness range, i.e., below 5nm, this analysis demonstrates a way to obtain the absolute value of the refractive index independently of other parameters.
The thin film index is deduced from the slope of the kinetic equation real(ρ(t))=versus im(ρ))² plot the Nestler,Ham equation 7-b.
Concerning the SE choice, no more than four LED sources wavelengths demonstrates that not so many wavelengths are useful. Furthermore with the knowledge of one monolayer thickness, one can be very confident in total multilayer thickness in the total ald processing..
Beside the interest of getting new single shot SE, going further to polarimetry is very promising technique. Depolarization effects provide information on total layer filling. A full Mueller matrix measurement instrument , i. e. a full single shot polarimeter is able to detect it.
Bibliography
[1] P. Drude, The Theory of Optics (Longmains, Green and Co., 1902).
[2] H. Arwin ICSE4 Stockholm and ref 6 chapt 12
[3] H.Arwin Applied Optics 43,15,3028 (2004) TIRE experiments
[4]”A theoretical approach to detect SARS-CoV-2Nano-layered SPR surface plasmon resonance-based highly sensitive biosensor for virus detection”:Md. Moznuzzaman,1 AIP Advances 11, 065023 (2021); doi: 10.1063/5.00
[5]”The Density and Refractive Index of Adsorbing Protein Layers” Janos Vörös Biophysical Journal Volume 87July 2004 553–561 see the Feijter's formula (de Feijter et al., 1978)
[6]Investigating Protein Adsorption via Spectroscopic Ellipsometry Maria F. Mora, Jennifer L. Wehmeyer, Ron Synowicki,and Carlos D. Garcia. Biological Interactions on Materials Surfaces,
[7].P. Nestler, C. A. Helm ,25, 22,2707, Opt.Express (2017).
[19]”Computation of Refractive Indices of Corona Viruses” Current Optics and Photonics Vol. 4, No. 6, December 2020, pp. 566-570
[8] E.V. Skopin,* J.L Deschanvres, and H. Renevier Phys. Status Solidi A2020, 1900831 (2020). [9-a] ZnO and Al2O3 data made available with courtesy of J.L.Deschanvres , RAFALD 2015 Workshop Grenoble (France)
[9] see https://www.film-sense.com and FS-1 manual user’s guide
[10] R.M.A. Azzam 8464 Research Article Vol. 55, No. 30 / October 20 2016 / Applied Optics
[11]US pat US6233380 05/15/2001 , US6791684 09/14/2004 ST N0 0504036 22.12.2005 US pat ST N0 0504036 22.12.2005 US pat ST N0 0504036 22.12.2005 US pat F.Ferrieu
[11a]”Fundamental quantum limits in ellipsometry” Ł. Rudnicki,1,2 L. L. Sánchez-Soto, G. Leuchs and R. W. Boyd,Optics Letters ,Vol. 45, No. 16 / 15,4607, August 2020 4607
[12] 12a see https://refractiveindex.info/ and earlier from 12b F. Ferrieu J.H. Lecat JES vol 137, 7, 2203 July1990.
[13] R.M.A. Azzam and N.M. Bashara “Ellipsometry and polarized light” :ISBN 0 444 87016 4 , see also p.436 Chapter 6
and “Handbook of Ellipsometry” G.Tompkins & E.A. Irene W.A.Publishing ISBN 3-540-22293-62005
[14] Application note.US Patent #9,354,118
[15] A commercial version could be deliverable please contact the author
[16] "A Simple Procedure for Calculating Atmospheric Water Vapor Concentration", Gregory J. McRae (1980)Journal of the Air Pollution Control Association, 30:4, 394-394, 1980.
[17] “Physical surface adsorption and Molecular Surface Fractal Analysis (MFSA) detected with Spectroscopic Ellipsometry “ F.Ferrieu , J-L Stehlé Applied Surface Science 256S (2009) S96–S100
[18] Hans-Jürgen Butt, Karlheinz Graf, Michael Kappl “Physics and Chemistry of Interfaces”. Hans-Jürgen Butt, Karlheinz Graf, Michael KapplISBN: 3-527-40413-9(2003).
[19]”Understanding the effect of H2O on CO2 adsorption capture: mechanism explanation, quantitative approach and application “,Sustainable Energy & Fuels · November 2020 DOI: 10.1039/d0se01179g
[20]”The Role of Water in Adsorption-based CO2 Capture Systems”. D. Marx et al. Energy Procedia 37 (2013) 107 – 114
[20]Adsorption of carbon dioxide, methane, and their mixtures in porous carbons: effect of surface chemistry, water content, and pore disorder.P. Billemont, B. Coasne, G. De Weireld DOI:10.1021/la3048938 CID: 19607386 2013
[21]”Polarimetry of light scattered by surface roughness and textured films and periodic structures in nanotechnologies: a new challenge in instrumentation and modeling” F. Ferrieu, NanoCharM Workshop on Advanced Polarimetric Instrumentation EPJ Web of Conferences Volume 5, 2010 API'09 504001 (2010)https://doi.org/10.1051/epjconf/20100504001
[22]S.R. Cloude Vol. 30, No. 4 / April 2013 / J. Opt. Soc. Am. A
[23]”Mueller matrix metrology: Depolarization reveals size distribution”. L.Voloshenko et al Appl. Phys. Lett. 115, 063106 (2019); and https://doi.org/10.1063/1.5094409
[24]M. Zerrad, J. Sorrentini, G. Soriano, and C. Amra, “Gradual lossof polarization in light scattered from rough surfaces: electro-magnetic prediction,” Opt. Express 18, 15832–15843 (2010).
[18-a]“Investigating Protein Adsorption via Spectroscopic Ellipsometry” Maria F. Mora, Jennifer L. Wehmeyer, Ron Synowicki and Carlos D. Garcia. Biological Interactions on Materials Surfaces,
DOI 10.1007/978-0-387-98161-1_2, © Springe 2009
[19]”Computation of Refractive Indices of Corona Viruses” Current Optics and Photonics Vol. 4, No. 6, December 2020, pp. 566-570
[19] "A Simple Procedure for Calculating Atmospheric Water Vapor Concentration", Gregory J. McRae (1980)Journal of the Air Pollution Control Association, 30:4, 394-394, 1980.
[19]”Surface Reactions of Carbon Dioxide at the Adsorbed Water−Iron Oxide Interface “J. Baltrusaitis ,VH. Grassian J. Phys. Chem. B 2005, 109, 25, 12227–12230
[22]”Stokes-vector and Mueller-matrix polarimetry”R.M.A. Azzam 1396 Vol. 33, No. 7 / July 2016 / JOSA A
[23]”Mueller matrix metrology: Depolarization reveals size distribution” Appl. Phys. Lett. 115, 063106 (2019); https://doi.org/10.1063/1.5094409 I Voloshenko, B. Gompf.
[24]”Polarimetry of light scattered by surface roughness and textured films and periodic structures in nanotechnologies: a new challenge in instrumentation and modeling” F. Ferrieu, NanoCharM Workshop on Advanced Polarimetric Instrumentation EPJ Web of Conferences Volume 5, 2010 API'09 504001 (2010)https://doi.org/10.1051/epjconf/20100504001
[25]”Molecular level investigation of methane and carbon dioxide adsorption on SiO2 Surface “J.Zhao, Z. Wang,P. Guo, Q. Luo Computational Materials ScienceVolume 168, 2019,213-220 (2019)
[26]”Mueller matrix metrology: Depolarization reveals size distribution”. L.Voloshenko et al Appl. Phys. Lett. 115, 063106 (2019); and https://doi.org/10.1063/1.5094409
[18-a]“Investigating Protein Adsorption via Spectroscopic Ellipsometry” Maria F. Mora, Jennifer L. Wehmeyer, Ron Synowicki and Carlos D. Garcia. Biological Interactions on Materials Surfaces,
DOI 10.1007/978-0-387-98161-1_2, © Springe 2009
[19]”Computation of Refractive Indices of Corona Viruses” Current Optics and Photonics Vol. 4, No. 6, December 2020, pp. 566-570
| |
|
|
Fig 1 data provided from courtesy of PHELMA [8-a ] obtained during the first SE installation of a FS-1 insitu ellipsometer: above and right :Typical acquisition data in ald ZnO zinc oxide multilayer sample process at 300°C inside a lab customized chamber. On the left details as inset and zoomed are observable the corresponding to the successive operations:injection( 0-100), adsoprption,(time scale 100-140sec ) adsorption and oxidation (140-160 sec ),nitrogen purging of a monolayer as detailed in ref [8]. |
|
|
|
| Fig2. Small wafer by hand shifted spatial positions displacements on a wafer with native oxide on top tF : As SE measured versus wafer position (right figure) during time, on the left , the corresponding linear plots for the wavelengths LED light sources ,here,465, 565 595 and 637nm, from the SE ellipsometer (ex situ data :See details in text) | |
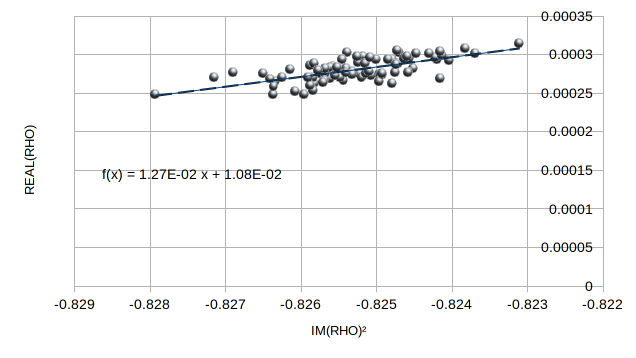 |
| Fig.3 Linear plot as ² at each 4 SE led wavelengths and associated trend linear lines providing S and zero film thickness abcissa. the associated trend line providing slope S and zero film thickness abcissa in Al2O3 ald at 200°C recalculated with data of Table1. |
Fig. 4,5 selecting time range during the process where adsorption occurs i.e. in the 90-130 secs range at 1 sec/data rate shown that the linear equation applies demonstrating the nature of the process. ( Fig 5 on the left) Continuous line is calculated with literature data from table 1 & 2 as well as with the Eq 2 for ZnO see more in text. System could be handle with a faster rate (up o 50ms) increasing the confidence results with more data when describing the growth phases
|
Wavelengths |
N+ i ksubstrat |
|
n(Al2O3) |
|
|
637nm(25°C) |
|
3.881+i0.0182 |
|
1.6770 |
|
n(300°C Silicon) |
465.46 |
4.7207 0.15639 |
|
1.682 |
|
|
525.05 |
4.03056 0.078672 |
|
|
|
|
595.62 |
4.0559 0.044039 |
|
|
|
|
637.14 |
3.961 0.0326 |
|
Fit :nFilm=1.68 |
Table 1 Used parameters which fit the experimental data for ald alumina on silicon substrate processed sample
and adopted n,k substrate values taken from literature [12a]for this analysis.
|
|
Fig.6,7 (left)The Instrument prototype inside gas cabinet with the Iot sensors,( the front white breadboard and processor card is interfaced to the SE in server sockets mode.Simultaneous measure of CO2,CO,CH4,NH3,%RH, T°C ,atmospheric pressure hPa values are accessed together with the remote ellipsometry data, on fig 7 (right) global User Interface VNC display screen monitoring during acquisition.
F ig. 8,-a (left) Film equivalent thickness type iV isotherm t-curve versus %RH humidity in the close box filled with a mixing CO2/H2O.max amplitude roughly 12 nm. Arrows indicate the mechanism first fast adsorption as %rh CO2 ratio increases and desorption with the return slowly to outside ambient desorption mechanism. On the right fig 8, the refractive index versus the CO2 concentration in part per million (ppm)) as calculated l from the Drude analysis,(Eq.7 )detailed below. Within the r. i., the refractive index nF ,the effective medium approximation EMA,[eq 8-9], provides a volume fraction V, i. e., .the occupied volume fraction by H2 O,(Eq.9)


